
Live insight, not month-end surprises
Technology is what sets JAY apart. We use dashboards, automation and AI to turn financial data into live, easy-to-read insight without waiting for month-end or wading through spreadsheets.
What a JAY dashboard can show
Every dashboard is tailored to your business. Typical views include:
Cash & Liquidity
Current cash position, expected inflows and outflows, and forecast cash needs.
Sales & Margin
Revenue and gross margin by product, customer, branch or channel.
Receivables & Payables
Ageing of debtors and creditors, collection performance and payment planning.
Stock & Working Capital
Stock levels, slow-moving items, cash cycle and working capital trends.
Budget vs Actual
Performance against plan, with variances highlighted for action.
Key Ratios & KPIs
The handful of measures that matter most to your business, tracked over time.
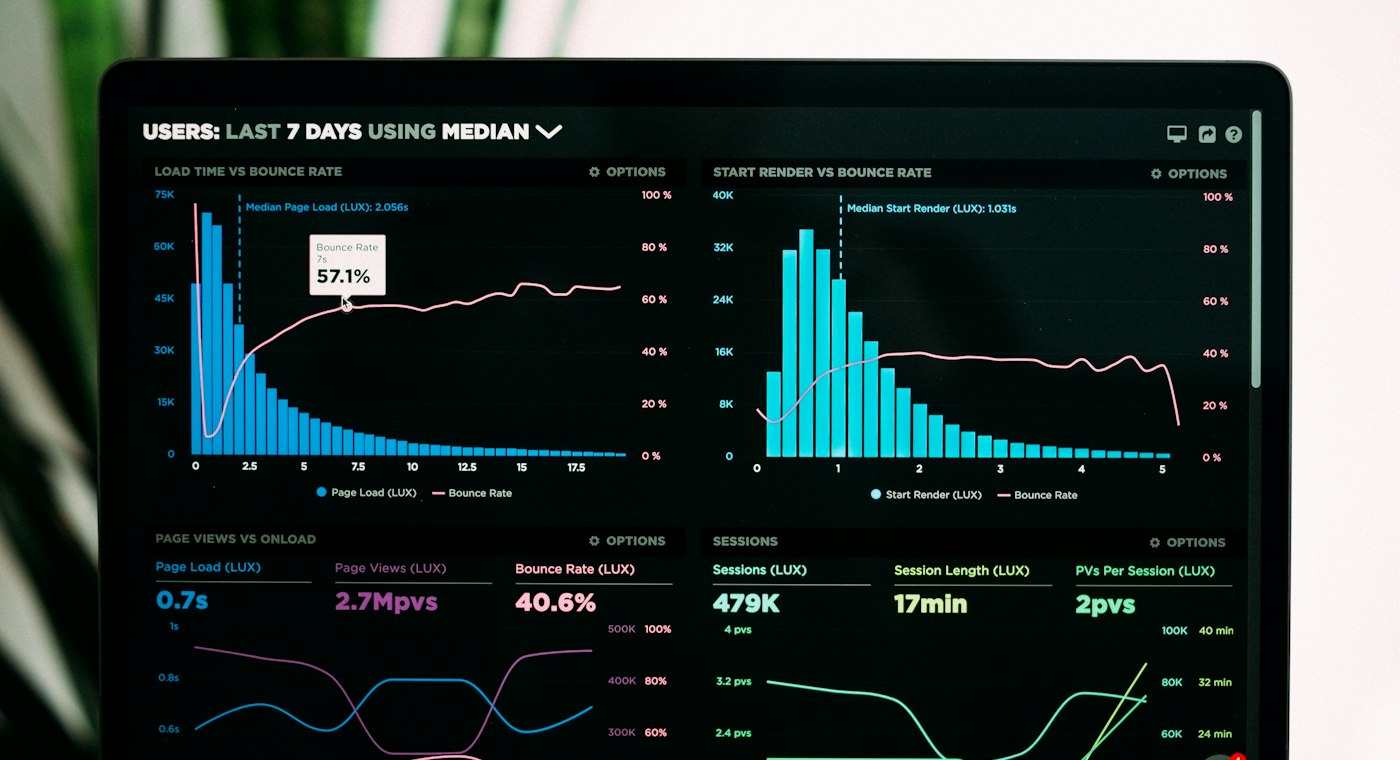
From raw data to decisions
We use data, automation, analytics and digital tools to improve the speed, accuracy and accessibility of financial and business information, connecting financial intelligence with operational performance.
In practice this means automated data flows from your systems into live dashboards, routine work handled by automation instead of manual effort, and AI-assisted analysis that highlights what matters, so decisions are based on current, dependable information.
- See it sooner. Know what is happening in the business without waiting for month-end.
- Trust the numbers. One version of the truth for owners, managers and advisers.
- Act on what matters. Variances, risks and opportunities highlighted, not buried in spreadsheets.
- Spend time on decisions. Less manual reporting; more analysis and advice.
Imagine your business on one screen
We will show you what a tailored JAY dashboard could look like for your business.